
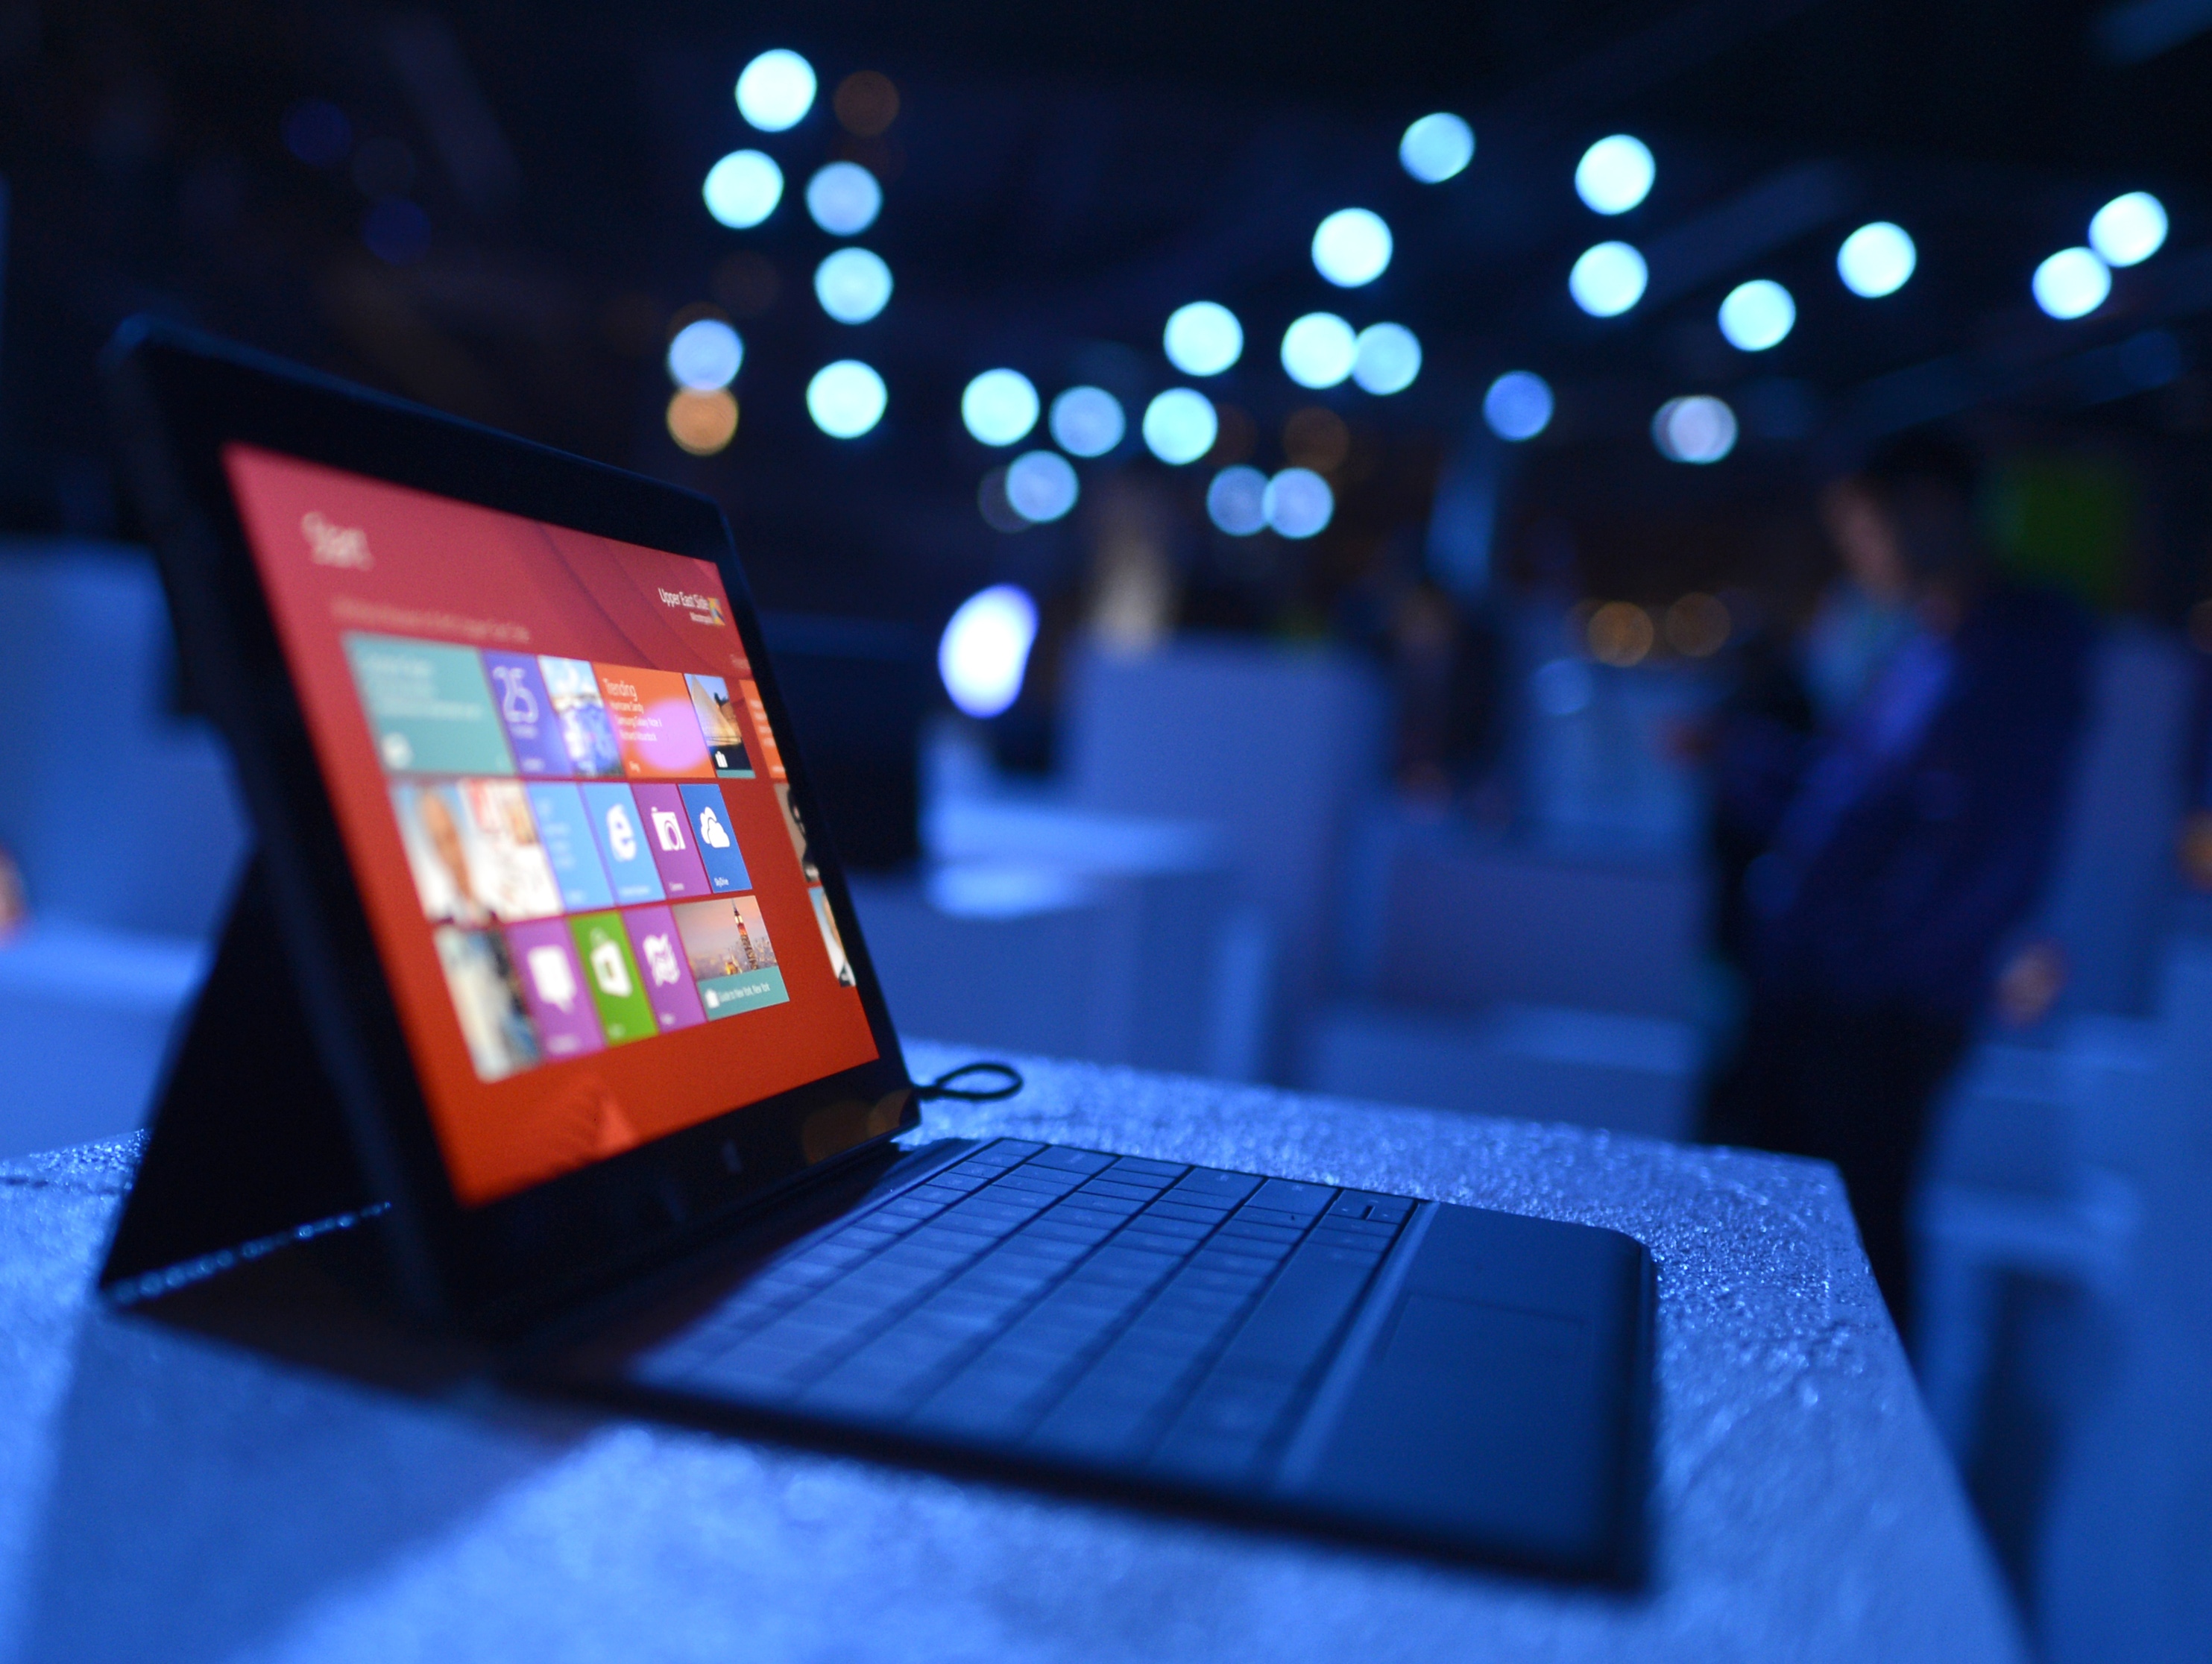
MICROSOFT INCREASED EARNINGS

Microsoft reported a 6% increase in revenues.
The recipes in this 3rd quarter sales increased to USD 21 700 mn, exceeding the estimated by the forecast of USD 21,100 mn.
Earnings per share fell to USD 0.62 overcoming USD 0.53 estimated by analysts.
The results were driven by the growth of cloud services unit and the Ofiice 365 subscribers numbers to increase 35% to 12.4 mn.
The appreciation of the dollar was also one of the factors that conditioned the Microsoft giant numbers.
“Customers continue to choose Microsoft to transform their business and as a result we saw incredible growth across our cloud services this quarter,” said Satya Nadella, chief executive officer at Microsoft. “Next week at Build we’re excited to share more about how we’re empowering every individual and organization on the planet to achieve more with the next generation of our platforms.”
Read more:
http://www.microsoft.com/investor/default.aspx
http://www.anandtech.com/show/9187/microsoft-releases-fy-2015-q3-financial-results

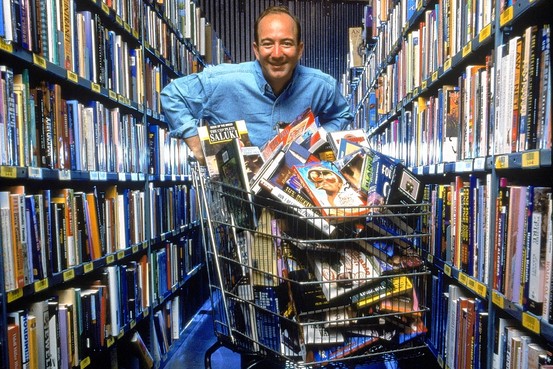
AMAZON ATTRACTING MORE CUSTOMERS

Amazon.com reported quarterly sales that beat market expectations (USD 22,700 mn vs. USD 22,400 mn).
The unit of web/cloud services (which was discriminated against by the 1st time) to record a 49% growth for the USD 1570 mn.
In 1Q15 the online retailer suffered losses of USD 0.12 per share which compares favorably with the loss of USD 0.23 per share a year earlier.
For 2Q15, the company projects sales of USD 20,600 mn – USD 22,800 mn and operating results between USD 500 mn and USD 50 mn loss of profits.
Despite the 15% growth in revenues, the company reported a loss, as it continues to make strong investments related to various projects.
Amazon Sources said the company expects to continue to increase turnover in the coming quarters.
Amazom CEO Jeff Bezos, know that investments in fast delivery and data center services will attract more customers to the online retailer
Read more:
http://phx.corporate-ir.net/phoenix.zhtml?c=97664&p=irol-irhome
http://www.fool.com/investing/general/2015/04/25/the-4-largest-markets-for-amazoncom-inc.aspx
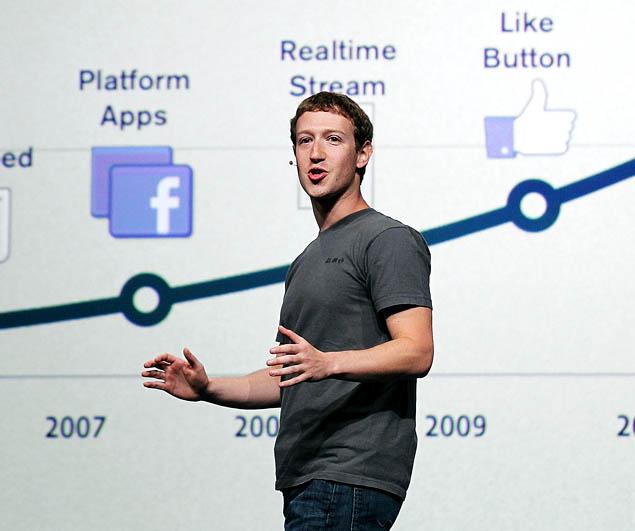
FACEBOOK WINS WITH ADVERTISING

FACEBOOK reported its quarterly results.
The social network introduced an EPS above expectations (USD 0.42 vs. USD 0.40) and revenue slightly below consensus (USD 3540 mn vs. USD 3570 mn).
Revenues from advertising increased by 46% YoY to USD 3320 mn and active users amounted to 1 440 mn (vs. 1430 mn expected) – via mobile users increased by 24% to 1.25 thousand mn.
The appreciation of the dollar penalized Group sales in USD 190 mn and the CFO has designed a superior exchange impact in the current quarter.
Mark Zukerberg´s company has been a focus for European legislation.
Employers may not ask an employee or job applicant on the information you share on social networks, according to a recommendation of the Council of Europe.
“Employers should not question or ask an employer or job seeker access to information he or she share with others online, including through social networks”, can be read in the document approved on April 1, which is being released by the Director at e-General for Justice Policy.
The decision, which replaces the text on the processing of personal data also reinforces the privacy safeguards in emails. Where an employee leaves the company, the electronic address must be immediately extinguished.
The employer can only access the emails with permission and employee presence.
Read more:

GOOGLE ADVERTISING PAYS THE PRICES
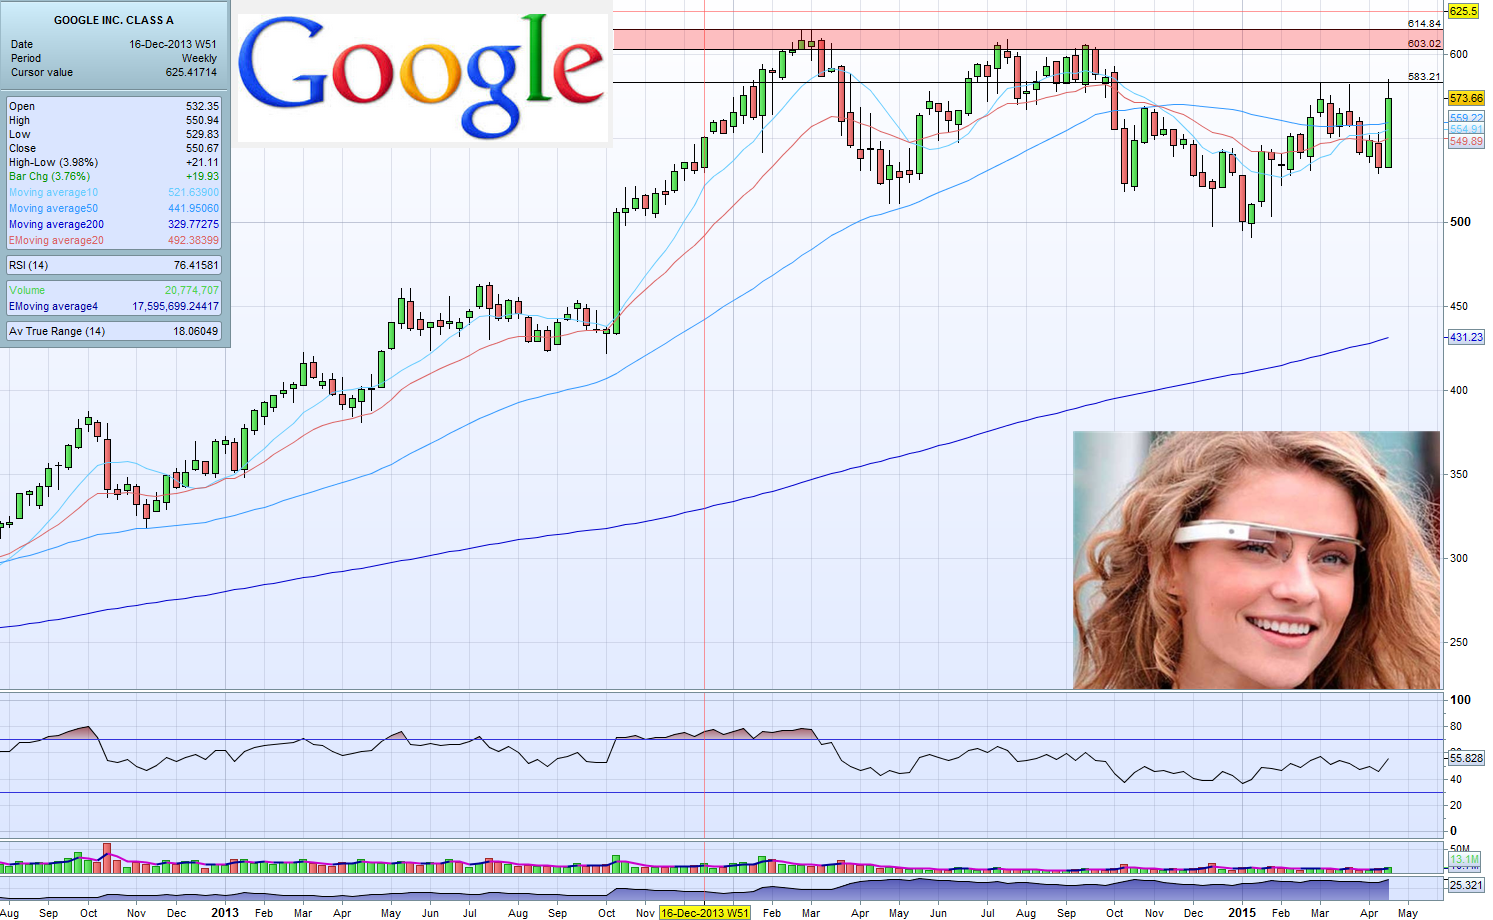
Google reported revenues of USD 13 900 mn, slightly below USD 14 000 mn expected by the market.
There was a growth of 13% of advertising volume to offset the 7% drop in their prices.
Advertising was still sufficient to offset the negative impact of the appreciation of the dollar.
Earnings per share amounted to USD 6.57 per share in, with the market estimate USD 6.63.
Operating costs (USD 6460 mn) increased by 21%, registering a slowdown from the 35% growth the previous period.
For the past several years, Wall Street has obsessed about Google’s declining cost-per-click — the amount of money that Google makes when consumers click on its online ads.
In Q1, Google’s CPC tumbled 7% year-over-year.
The conventional wisdom has been that the CPC decline is due to the shift to mobile computing. Consumers are increasingly accessing the Web on smart phones, and Google is not able to charge marketers as much for mobile ads as it can for the ads that are displayed on PCs.
Not so, said Google’s (outgoing) CFO Patrick Pichette during Thursday’s earnings conference call with analysts.
The real culprit, Pichette said, are the skippable “TrueView” video ads on YouTube.
“TrueView ads currently monetize at a lower rate than ad clicks on Google.com. As you know, video ads generally reach people earlier in the purchase funnel, and so across the industry, they tend to have a different pricing profile than that of search ads,” Pichette explained.
“Excluding the impact of YouTube TrueView ads, growth in Sites clicks would be lower, but still positive and CPCs would be healthy and growing Y/Y,” Pichette continued.
“Really we have two positive stories here,” Pichette said. “First, as I mentioned earlier, we are experiencing strength in mobile search and the CPCs in our core search business are continuing to grow Y/Y.”
“Second, viewership of YouTube videos and TrueView ads are growing significantly and YouTube’s contribution to our advertising revenues continues to grow at a strong rate Y/Y. We’re really pleased with how the YouTube business is progressing.”
The fact that mobile ads may not be the drag on Google’s ad rates that many had assumed could improve the company’s story on Wall Street. But the news that video ads don’t monetize as well as search ads may raise some eyebrows, given that video ads are generally considered to command some of the richest premiums in the online ad world.
Read more:


TOTAL TO ALL GAS
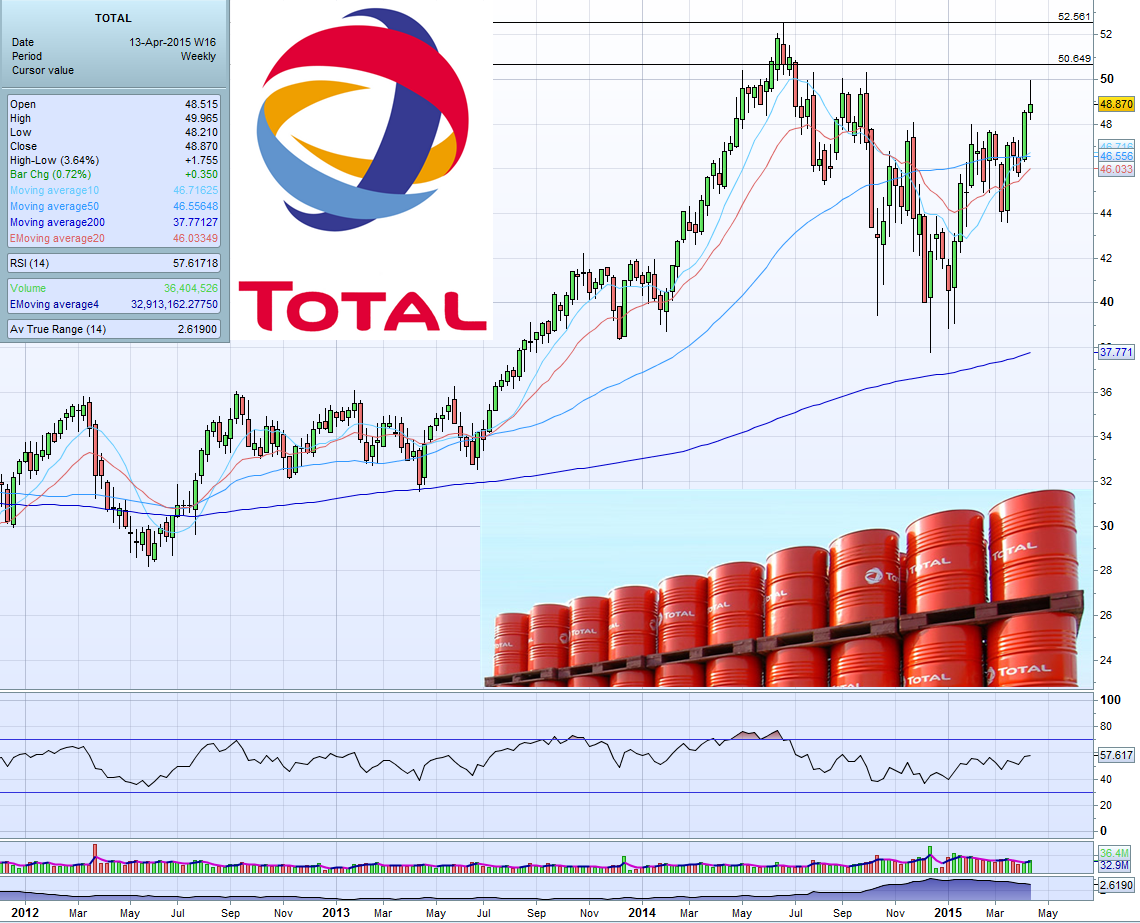
TOTAL SA saw the drop in oil prices lead to reductions in investment of 10% to 15% in the major oil companies and 30% to 40% in the smaller companies.
The company announced that excess capacity will continue in 2015.
Company Exploration & Production business tackles all the major technological challenges, from the deep offshore to liquefied natural gas, unconventional gas and oil sands. Our recognized expertise in these sectors demonstrates our ability to innovate.
Total S.A. is a French multinacional integrated oil and gas company and one of the five “Supermajor” oil companies in the world.
Its businesses cover the entire oil and gas chain, from crude oil and natural gas exploration and production to power generation, transportation, refining, petroleum product marketing, and international crude oil and product trading.
Total is also a large-scale chemicals manufacturer.
The company has its head office in the Tour Total in west of Paris.
Read more:
http://www.total.com/en/investors/investors
http://www.cnbc.com/id/102127844

UNILEVER GOING UP

Unilever announced preliminary first quarter sales, which reported a sales growth of 2.8% (vs. 2.1% estimated) and an increase in sales volume of 0.9% (vs. 0.4% expected) .
Total sales for the quarter amounted to EURO 12 800 mn, above EUR 12 300 mn expected by the market consensus.
The quarterly dividend is expected to be EUR 0.302 (vs. EUR 0.29). The CEO indicated that the beginning of the year was positive, helped by favorable currency movements.
On any given day, two billion people use Unilever products to look good, feel good and get more out of life.
With more than 400 brands focused on health and wellbeing, no company touches so many people’s lives in so many different ways.
Unilever portfolio ranges from nutritionally balanced foods to indulgent ice creams, affordable soaps, luxurious shampoos and everyday household care products.
They produce world-leading brands including Lipton, Knorr, Dove, Axe, Hellmann’s and Omo, alongside trusted local names such as Blue Band, Pureit and Suave.
Read more:
http://www.unilever.com/investorrelations/
http://www.ft.com/cms/s/0/6225c454-beab-11e4-8036-00144feab7de.html#axzz3XhA6TImr


SanDisk BAD RESULTS
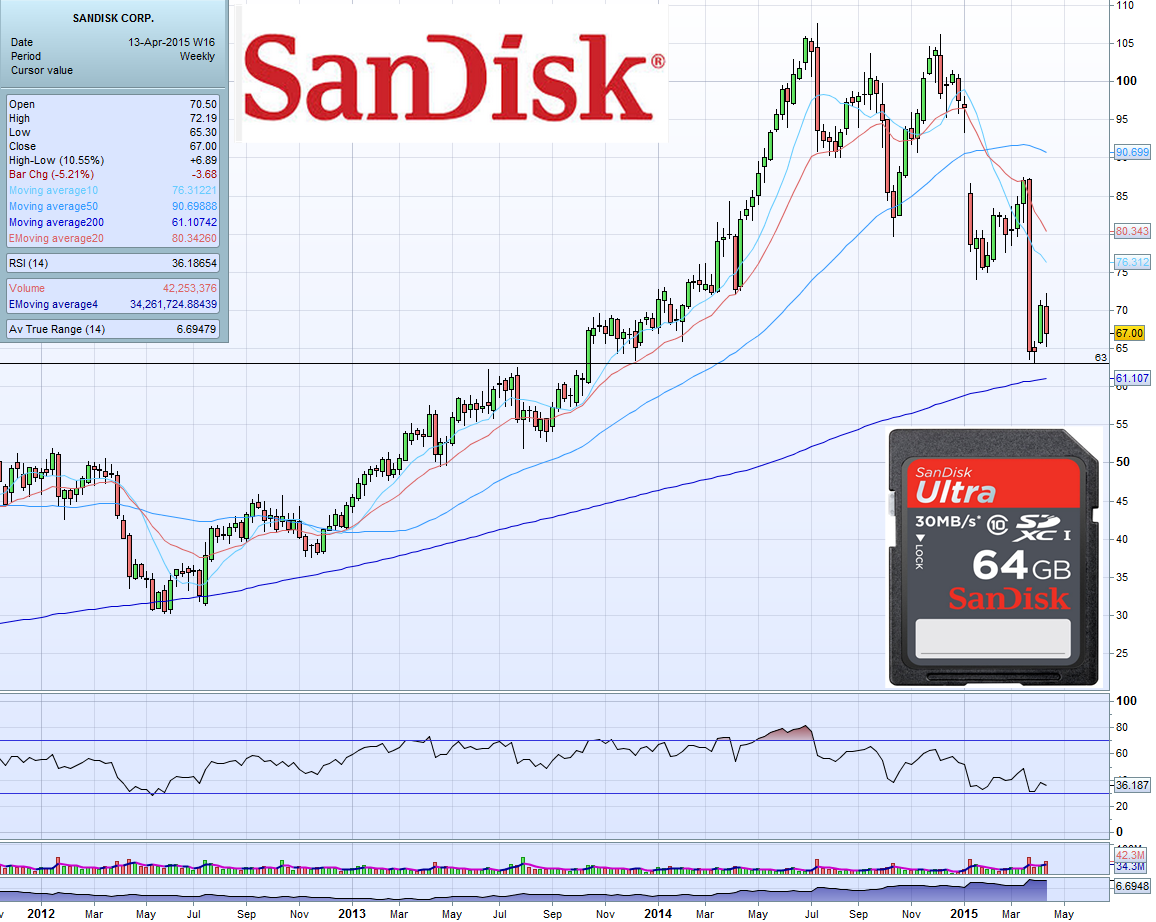
Technological SanDisk Corp introduced 1Q15 results, with EPS adjusted below expectations (USD 0.62 vs. USD 0.66) and revenues above the consensus (USD 1330 mn vs. USD 1.30000 mn).
The CEO proved to be “disappointed” with the results and said the company is taking steps to resume execution excellence demonstrated in the past.
The guidance for 2015 has been revised downwards and missed the market consensus – revenue of USD 5400 mn – USD 5700 mn vs. USD 6150 mn expected.
The sales target for USD 1000 mn companies was discarded, although the company renewed commitment of capital return to shareholders, with additional buy-backs of USD 750 mn this year.
SanDisk Corporation is an American Company that designs, develops and manufactures flash memory storage solutions and software.
It was founded in 1988 by Dr. Eli Harari, Jack Yuan and Sanjay Mehrotra, technology experts.
The company is based in Silicon Valley and has more than half its sales outside USA.
Its products are sold at more than 260,000 retail locations in more than 100 countries. SanDisk became a publicly traded company on NASDAQ in November 1995. As of February 2015, its market capitalization was over US$17 billion.
Read more:
http://investor.sandisk.com/phoenix.zhtml?c=86495&p=irol-irhomemain
http://www.zdnet.com/article/sandisk-q1-2015-earnings-hardware-flash-memory/


NOKIA VOLATILE TO RISE
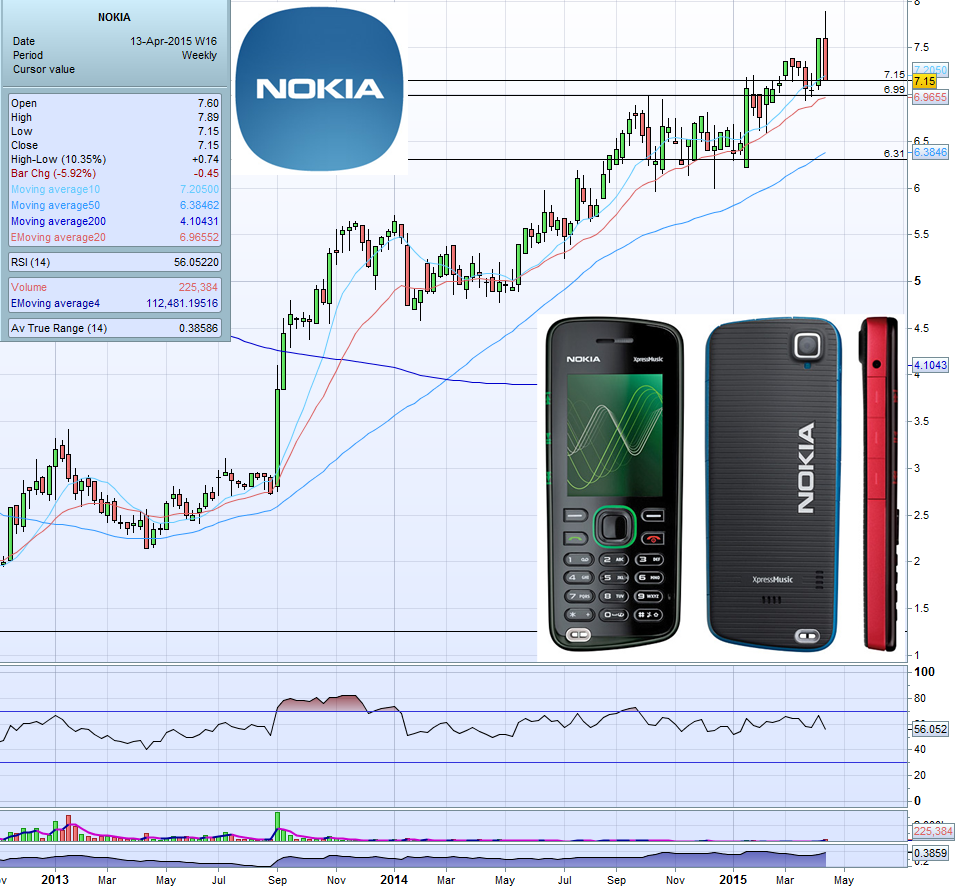
The Finnish company NOKIA (NOKA) has shown a lot of volatility in recent times.
Still, at least for the moment, we have no sign of weakness within the current range of prices. Increasing minimum and maximum are there, which is what really matters. In the short term, we can not rule out some additional correction but it is certain that, in that it does not pierce the last growing least or minimum reaction in 6.90 euros there is nothing to worry about.
The corrections to the level between 6.90 and 7 euros, weekly closure, are the ideal time to take advantage to open bullish positions.
The first objective of increase is in the resistance of 7.90 euros.
Recently the Finnish company Nokia (owned by Microsoft) announced the purchase of all shares of its French competitor Alcatel-Lucent in a transaction valued at 15,600 million euros.
The transaction will be carried out through a public offer of exchange of shares between the two companies, so that the shareholders of Alcatel-Lucent will receive 0.55 shares in the new company for each title of the former.
Nokia will get 66.5% of the combined group and Alcatel with the remaining 33.5%, creating a giant with about 114,000 employees and 26,000 million euros turnover.
The new company will be called Nokia Corporation, will be based in Finland and will be the world’s second largest manufacturer of mobile phone networks in terms of market share, behind Sweden’s Ericsson.
Read more:
http://company.nokia.com/en/investors
http://www.alcatel-lucent.com/investors

MOLANIS EXPERT ADVISORS

Molanis is considered the best graphic environment to create expert advisors and custom indicators for MetaTrader 4 and MetaTrader 5. No coding, programming or MQL knowledge is required.
Molanis creates ready-to-use expert advisors, Forex signals and custom indicators using the leading edge MQL code generator.
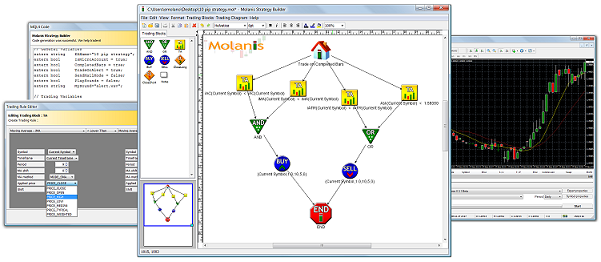
A strategy and expert advisor for MT4, can be created with just a few clicks, whether you are new to Forex or a professional Trader.
It is very easy and intuitive to create expert advisors in minutes
By drag Trading blocks from the Trading Library into the Trading Diagram, with less development time.
It is Designed to allow expert advisors with multiple currencies and multiple timeframes, with minimum effort, it can be used to create Forex Signals.

Technical Indicator Builder allows the design of Customs Indicators for MetaTrader 4.
It is Very easy and intuitive to create and test indicators in minutes, reducing development time.
Leading Edge Code Generation creates all the code for MetaTrader and we don´t need to share our strategy with external programmers.
The technical indicator uses mathematical calculations bringing countless possibilities and contains the Indicator Calculation Editor for complex calculations.
There is also a custom Indicator Builder Pro for MT5
The Custom Indicator Builder for MT5 is the only graphical environment that lets you design Custom Indicators for MetaTrader 5 in minutes.
It is Very easy and intuitive, create indicators with mouse click and drag.
You can turn your ideas into indicators and you don´t need to write a single line of code.
This is a custom Indicator builder is specifically designed for Traders.
Read more:
https://secure.activtrades.com/personalarea/OnlineApplication/Step1?lang=en
https://www.activtrades.co.uk/index.aspx?page=platforms_molanis
RENAULT supported by France

RENAULT SA (EPA: RNO) is a French manufacturer of vehicles founded in 1898 by Louis Renault.
Produces from small and medium cars, vans, buses and trucks.
It is known for developing prototypes, such as the Renault 16 or minibuses Twingo, Scénic and Espace.
The French state bought 9.6 million Renault shares, and is planning future purchases.
The cost of these purchases shall be between EUR 814mn and EUR 1,200 mn.
The State participation should be increased from 15% to 19.7%, with voting rights to increase to 23.2% (previous vs.17,7%).
This high involvement of the French State in the automaker should be temporary, serving only to protect the voting rights.
Read more:
http://group.renault.com/en/finance-2/analysts-investors/capital-markets/
![]()

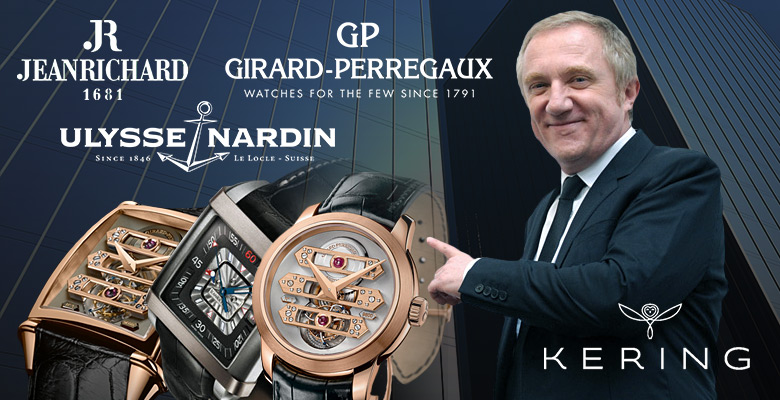
KERING LUXURY

KERING is a French company specializing in luxury goods and sports & lifestyle that distributes its products to over 120 countries worldwide.
The group has 22 different brands and employs about 37,000 workers.
Western Europe is the main market of the group, with 31% of its revenues are obtained in this block, in Japan sales represent 10% of total revenue and the Asia Pacific countries in total contribute 26%.
The group currently has a market cap of EURO 22.501mn.
The disclosure of the annual results exceeded expected by the market consensus, with consolidated revenues of 2014 to amount to EUR 10.038mn, an increase of 4.5% over the same period.
The annual net profit amounted to EUR 523,9mn, which compares favorably with the value of EUR 49,6mn registered in 2013. The company proposed a gross dividend per share of EUR 4.00, an increase of 7% over the previous period.
In recent years the company has been registering a sustained growth of its operational indicators, with particular emphasis on the positive development of its EBITDA margin.
The growth of luxury products in the Asian bloc is presented as an important trigger for the company, since the recipes in this book represent about 26% of total revenues.
The recent underperformance title – extreme compared to its comparable – does not reflect the favorable operating performance of the company.
The positive development of its operational indicators, the geographic mix of activity and the relative discount the fundamental level confer a potential upside to the title in the medium term.
Read more:
http://www.kering.com/en/finance

GOOGLE and APPLE BUY TWITTER
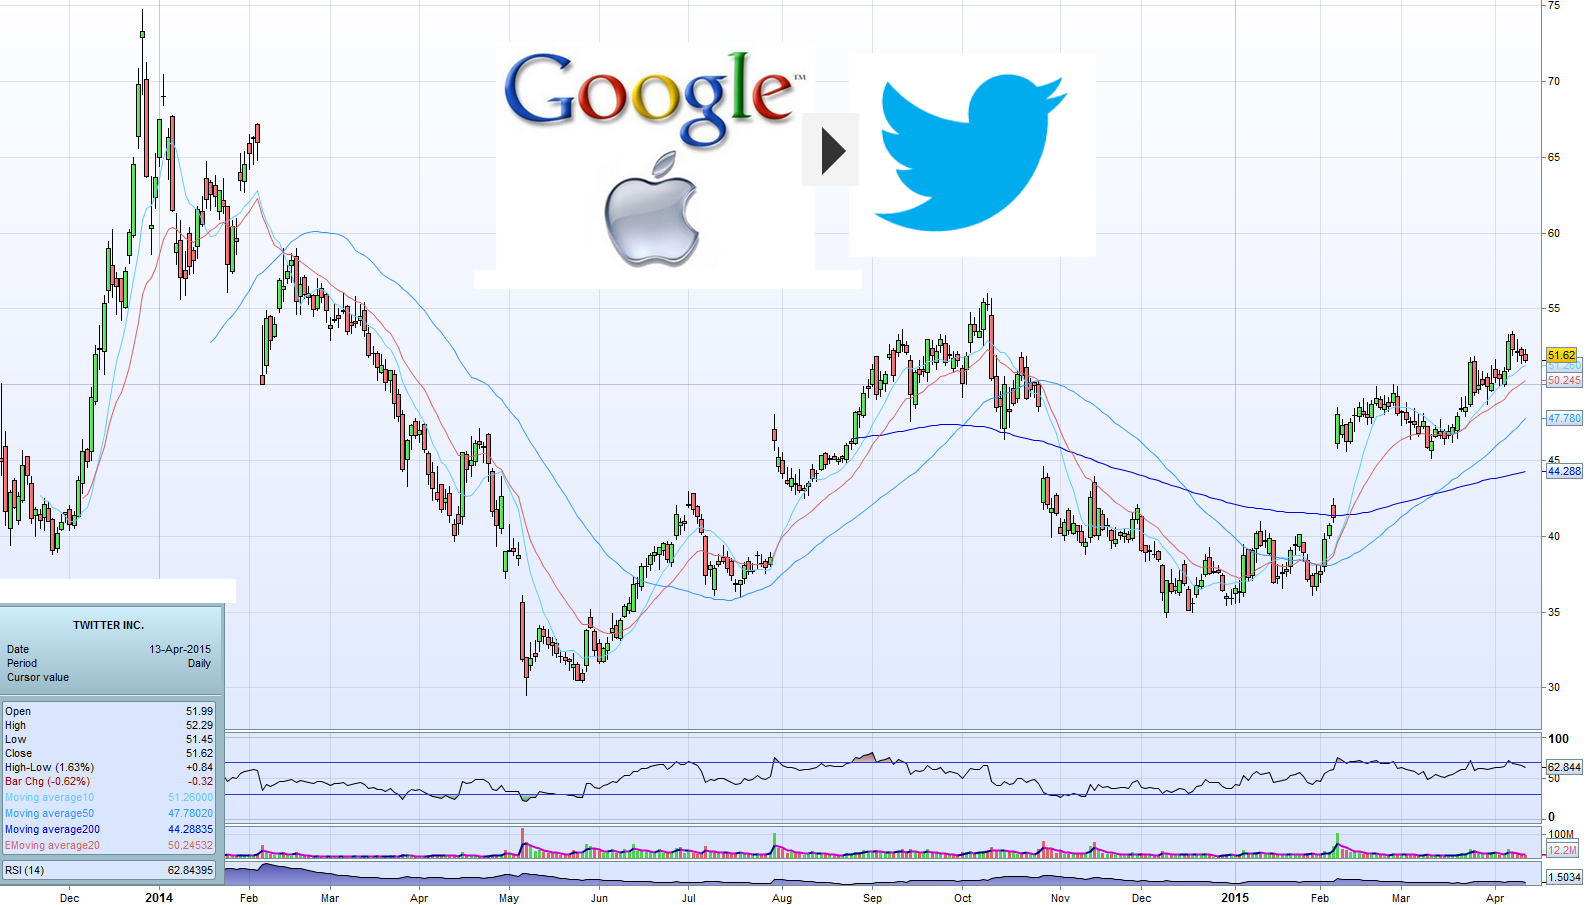
Twitter (NYSE: TWTR) is a global platform for public self-expression and conversation in real time.
By developing a fundamentally new way for people to create, distribute and discover content, Twitter democratized content creation and distribution, enabling any voice to echo around the world instantly and unfiltered.
The service can be accessed at TWITTER.COM, via the Twitter mobile application and via text message. Available in more than 35 languages, Twitter has more than 288 million monthly active users
There is a rumor that Twitter may be the subject of a purchase evaluation by two companies, shook positively the price of its shares.
Twitter has a market capitalization of over 33 billion dollars, making it accessible only to a few giants.
There is an almost sure that Google is one of two companies that are in the “race”, the strong another possible candidate is Apple.
The materialize to buy Twitter, will be the largest acquisition ever of either of these two companies but perfectly within reach of its treasury, Google has about 60 billion dollars of cash and Apple about 180 billion dollars.
Read more:
https://investor.twitterinc.com/


LVMH Moet Hennessy – Louis Vuitton RESULTS
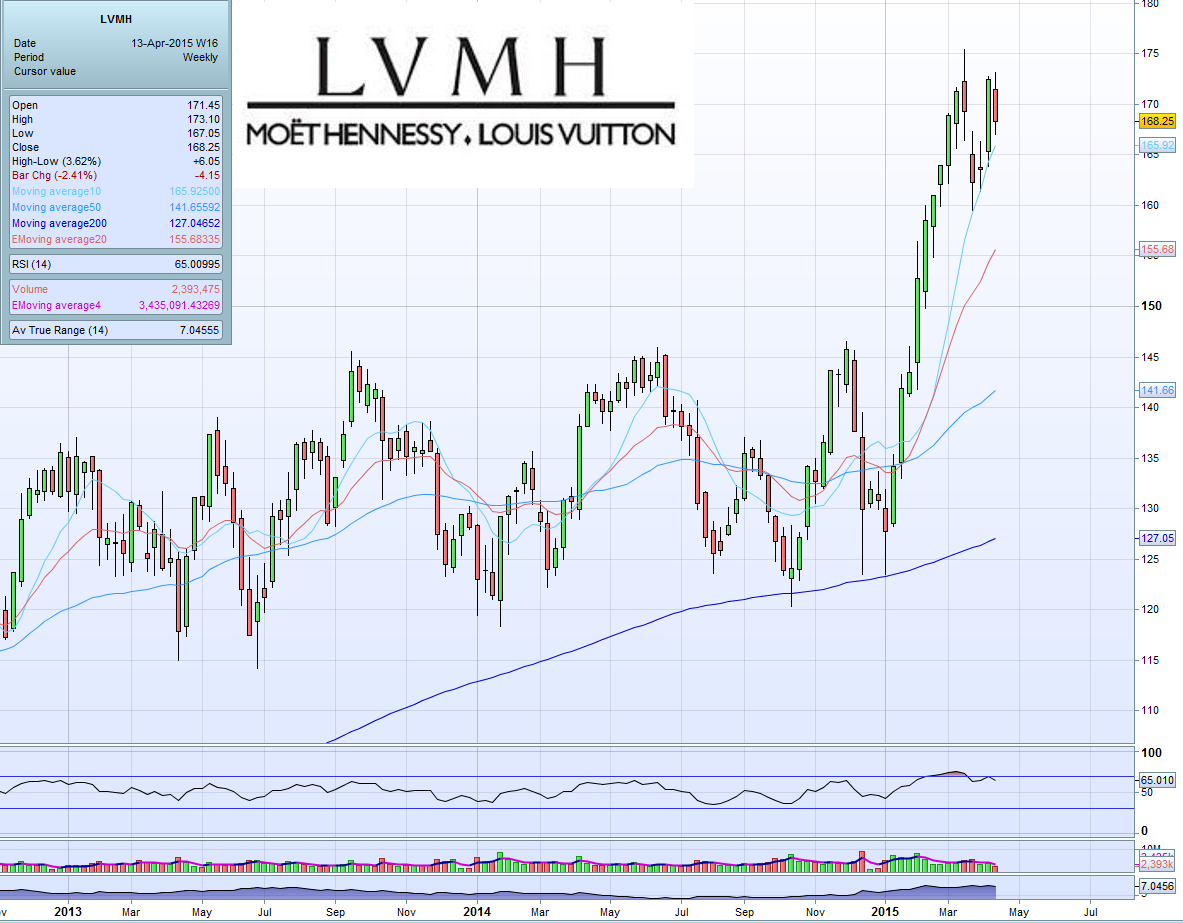
LVMH is a French multinational retailer of luxury goods, created in 1987 from the merger of designer Louis Vuitton and alcoholic beverage producer Moët Hennessy. The company has about 70 subsidiaries, which are managed autonomously, with each representing several luxury brands. With a market capitalization of EUR 85,770 mn, the company has around 120,000 employees worldwide.
LVMH presented a 3% increase in comparable sales for the 1st quarter, due to the depreciation of the Euro against the Dollar.
To remember that 70% of its sales are to markets outside the eurozone.
Louis Vuitton reported annual results that compare favorably with the same period last year, with revenues totaling EUR 30.638mn, an increase of 6% compared to 2013.
Free cash flow shrank 7% compared with 2013 to EUR 2.832mn. The company will propose to the General Meeting a gross dividend per share of EUR 3.20 (+ 3.0% over the previous period).
The saturation of the brand ‘Louis Vuitton’ in the Asian market, thereby reducing the “status” associated with it can be a penalty factor for the Group revenues (which represent 29% of the total).
The company has an appreciation of 24% since the beginning of the year.
When announcing the annual results, the title appreciated around 8% in just one session.
Despite the correction observed in mid-March, Louis Vuitton is still the title with the highest cumulative gains among peers in the industry.
Read more:
http://www.lvmh.com/investor-relations
http://www.bloomberg.com/quote/MC:FP

APPLE WATCH
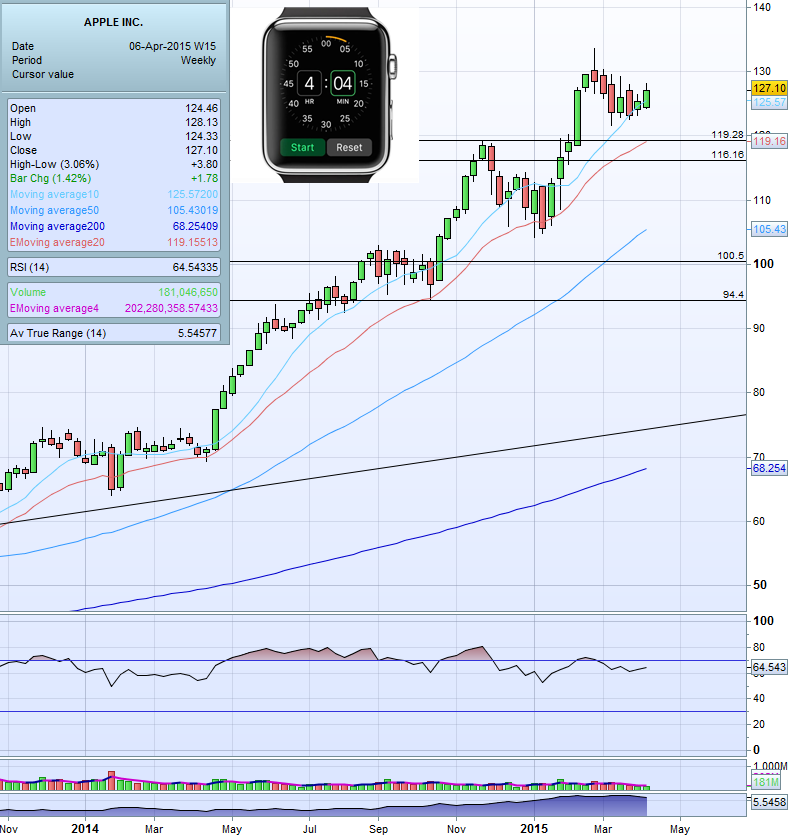
APPLE is counting down to the release of APPLE WATCH
Preorders for the Apple Watch started on Friday. After just 30 minutes initial supplies were sold soon.
Some people will be getting the Apple Watch on Apple’s launch date of April 24.
But based on Munster’s report, only a limited number of people are going to get the watch at the end of April. It seems most people will get the watch in mid-May, or June, which is a full nine months after Apple announced the watch.
It seems that Apple is having trouble making the watch. After all, when it announced the watch last September, it said it would release it in “Early 2015.” Initial reports suggested Apple was aiming for February. But, Apple officially announced a launch date of April 24.
The initial demand for the Apple Watch isn’t terribly surprising. Apple’s built-in fan base, combined with the company’s earned reputation for excellence, guarantees an initial surge of sales.
The first Apple Watch reviews came out this week, and they were not as enthusiastic as one might expect.
Reviewers did praise the design and the way it lets you leave your phone in your pocket more.
Let´s expect for next two weeks to see what will happen with the stock price.
Read more:

FACEBOOK VERY STRONG

FACEBOOKs upward monday candle is of such importance that indicates that investors are to believe the climbs.
The titles of the social network are in ‘free climb’ on and corrections to the last days consolidated the previous upward trend.
Above the level of the long $ 81 entries may aim to increase the maximum of $ 86.07.
Internet companies such as Facebook and Google, know that their business is on the users, and it is proposed that the Internet can reach the greatest possible number of people, recently informed The Wall Street Journal.
Meanwhile, both sides seek formulas that benefits all. That is, the Internet gets to where still not enough and that users will eventually pay for such connections.
Facebook has proposed a few years ago an idea that was based on this principle, Facebook Zero. This strategy was to bring the Internet to certain regions, offering its inhabitants to link to Facebook, for free, for a while.
Then, many of these new users, convinced of the advantages of the network, would eventually hire the services of a Teleoperadora.
Read more:


ALCOA´s earnings and outlook for the global economy
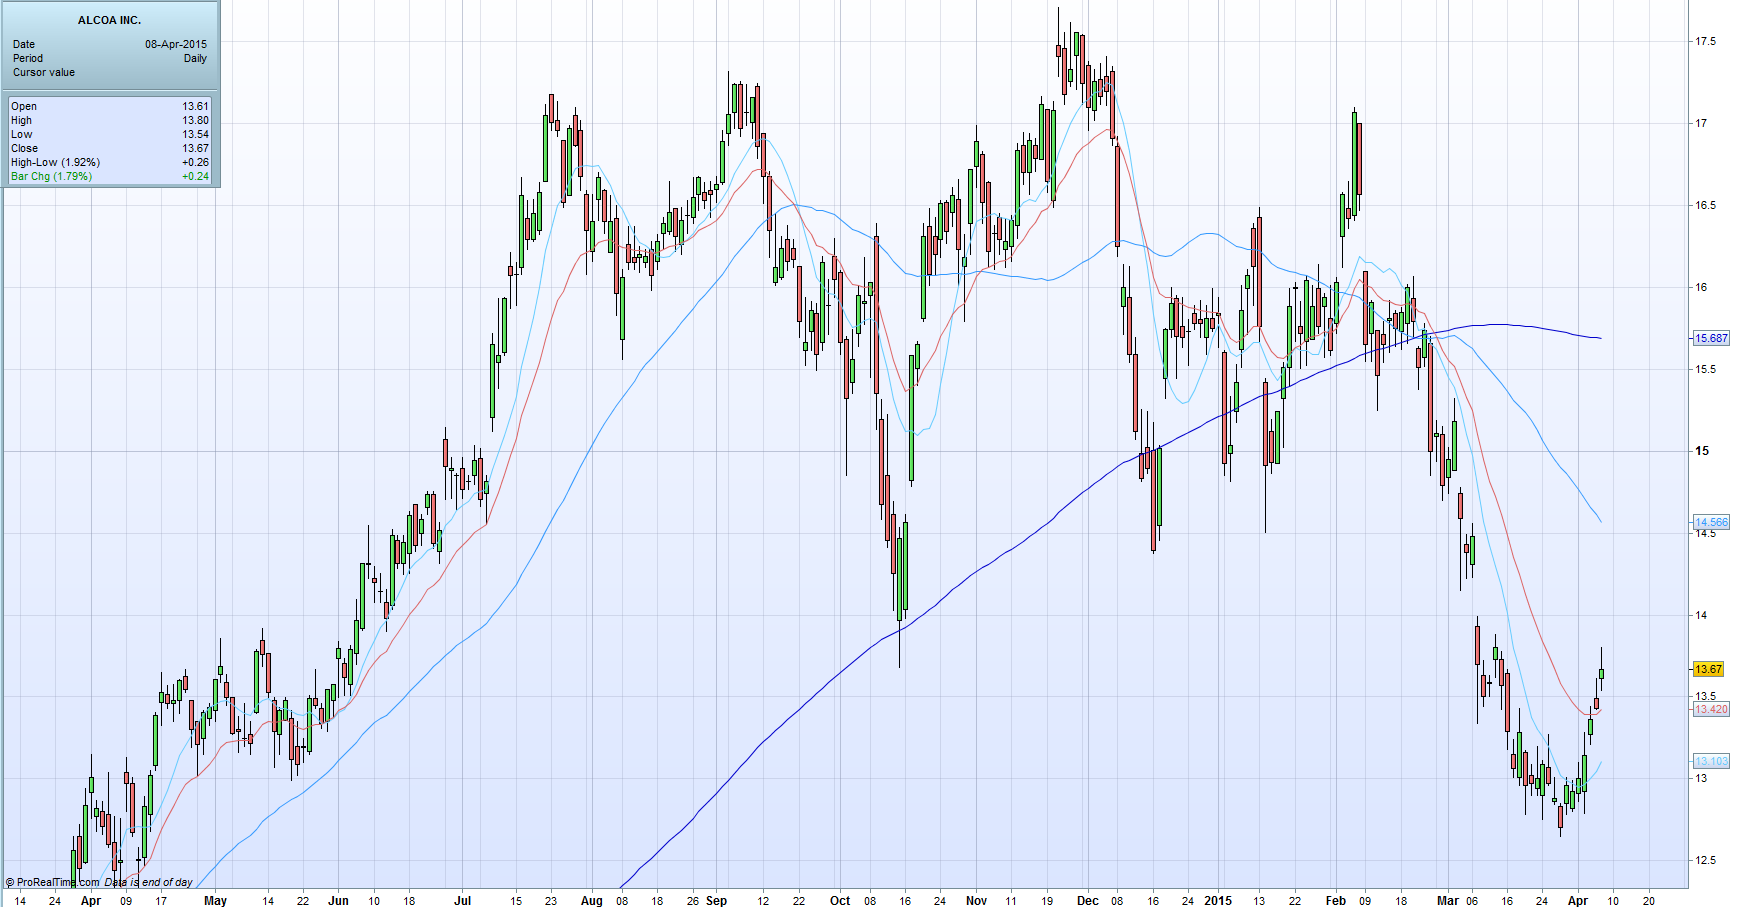
Alcoa is always the first presenting results and reported this quarter earnings.
Alcoa beat expectations per share while missing on revenue.
This giant of aluminum reported adjusted earnings per share of $0.28 against expectations for $0.26.
Revenue missed, however, coming in at $5.82 billion against expectations for $5.94 billion.
Alcoa’s report marks the unofficial start to earnings season.
Wall Street expectations for first quarter earnings have been ratcheted down significantly ahead of the start of earnings season, with earnings for the S&P 500 expected to decline 4,2% over the prior year, mostly owing to the decline in oil prices and the rally in the US dollar.
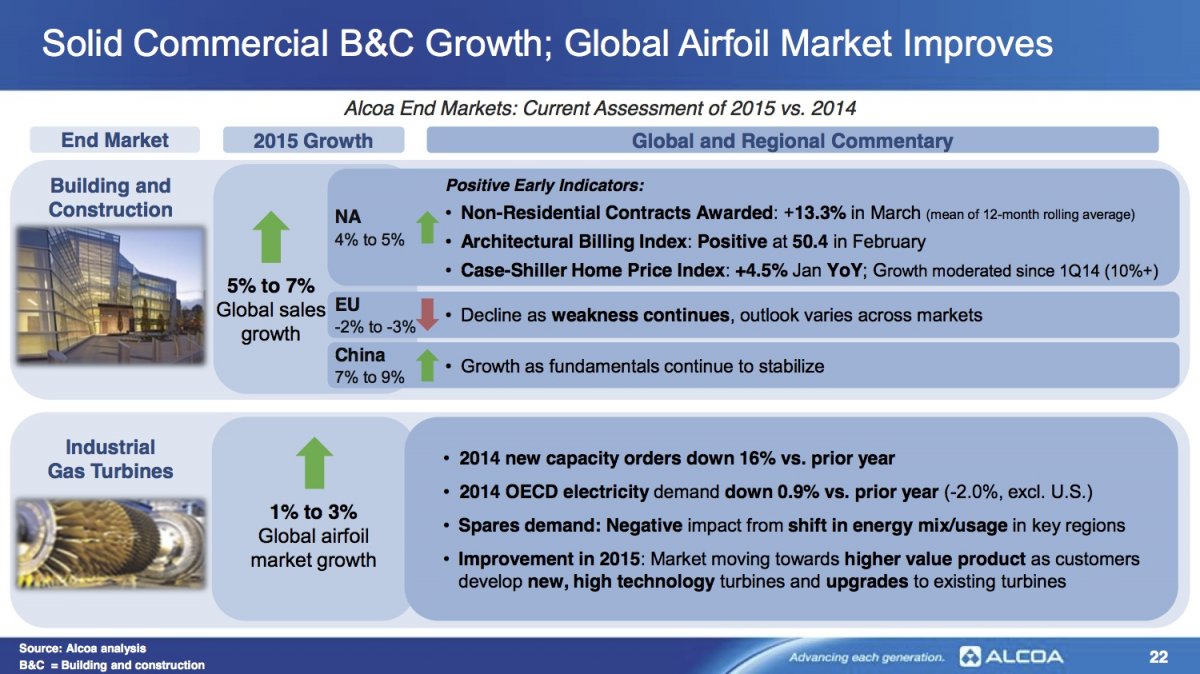
In its report, Alcoa maintained its 2015 growth projections for the aerospace, automotive, building and construction, industrial gas turbine, and packaging end markets.
The company also reaffirmed its outlook for growth in the aerospace, automotive, building, industrial gas, and packaging end markets.
Alcoa also lifted its final demand outlook for aluminum in 2015.
Read more:
http://www.alcoa.com/global/en/investment/info_page/home.asp
http://www.alcoa.com/global/en/news/news_detail.asp?pageID=20150306000262en&newsYear=2015


FedEx shops in Europe

The US FedEx has agreed to buy Dutch rival TNT Express, for 4.4 billion euros.
Therefore seeks to expand its activities in Europe.
FedEx is offering less than willing to pay the United Parcel Service (UPS) two years ago, a charge that was blocked by the Competition European Commission.
The two companies, FedEx and TNT Express, have a “conditional agreement” that FedEx offers eight euros per share of TNT, which assesses the Dutch company at 4.4 billion.
The offer is 33% higher than the closing price of TNT on Friday, a company that has not had an easy life on the stock market in the last 12 months, reflecting the operational difficulties in a sector with high competition – the transport sector of goods and logistics – and margins under pressure.
FedEx offer news made the shares of TNT shoot in Amsterdam stock exchange, to values close to eight euros per share offered by the US.
In January 2012theUPShad offered9.50 eurospershareofTNT, buteventually withdrewthe offerbefore theintransigenceof regulators.
With experienced operational deterioration, however, by TNT, the eight euros per share just earned the endorsement of the administration of TNT.
Read more:
http://investors.fedex.com/investor-home/default.aspx
http://www.tnt.com/corporate/en/site/home/investors/share_information/shareprice_monitor.html


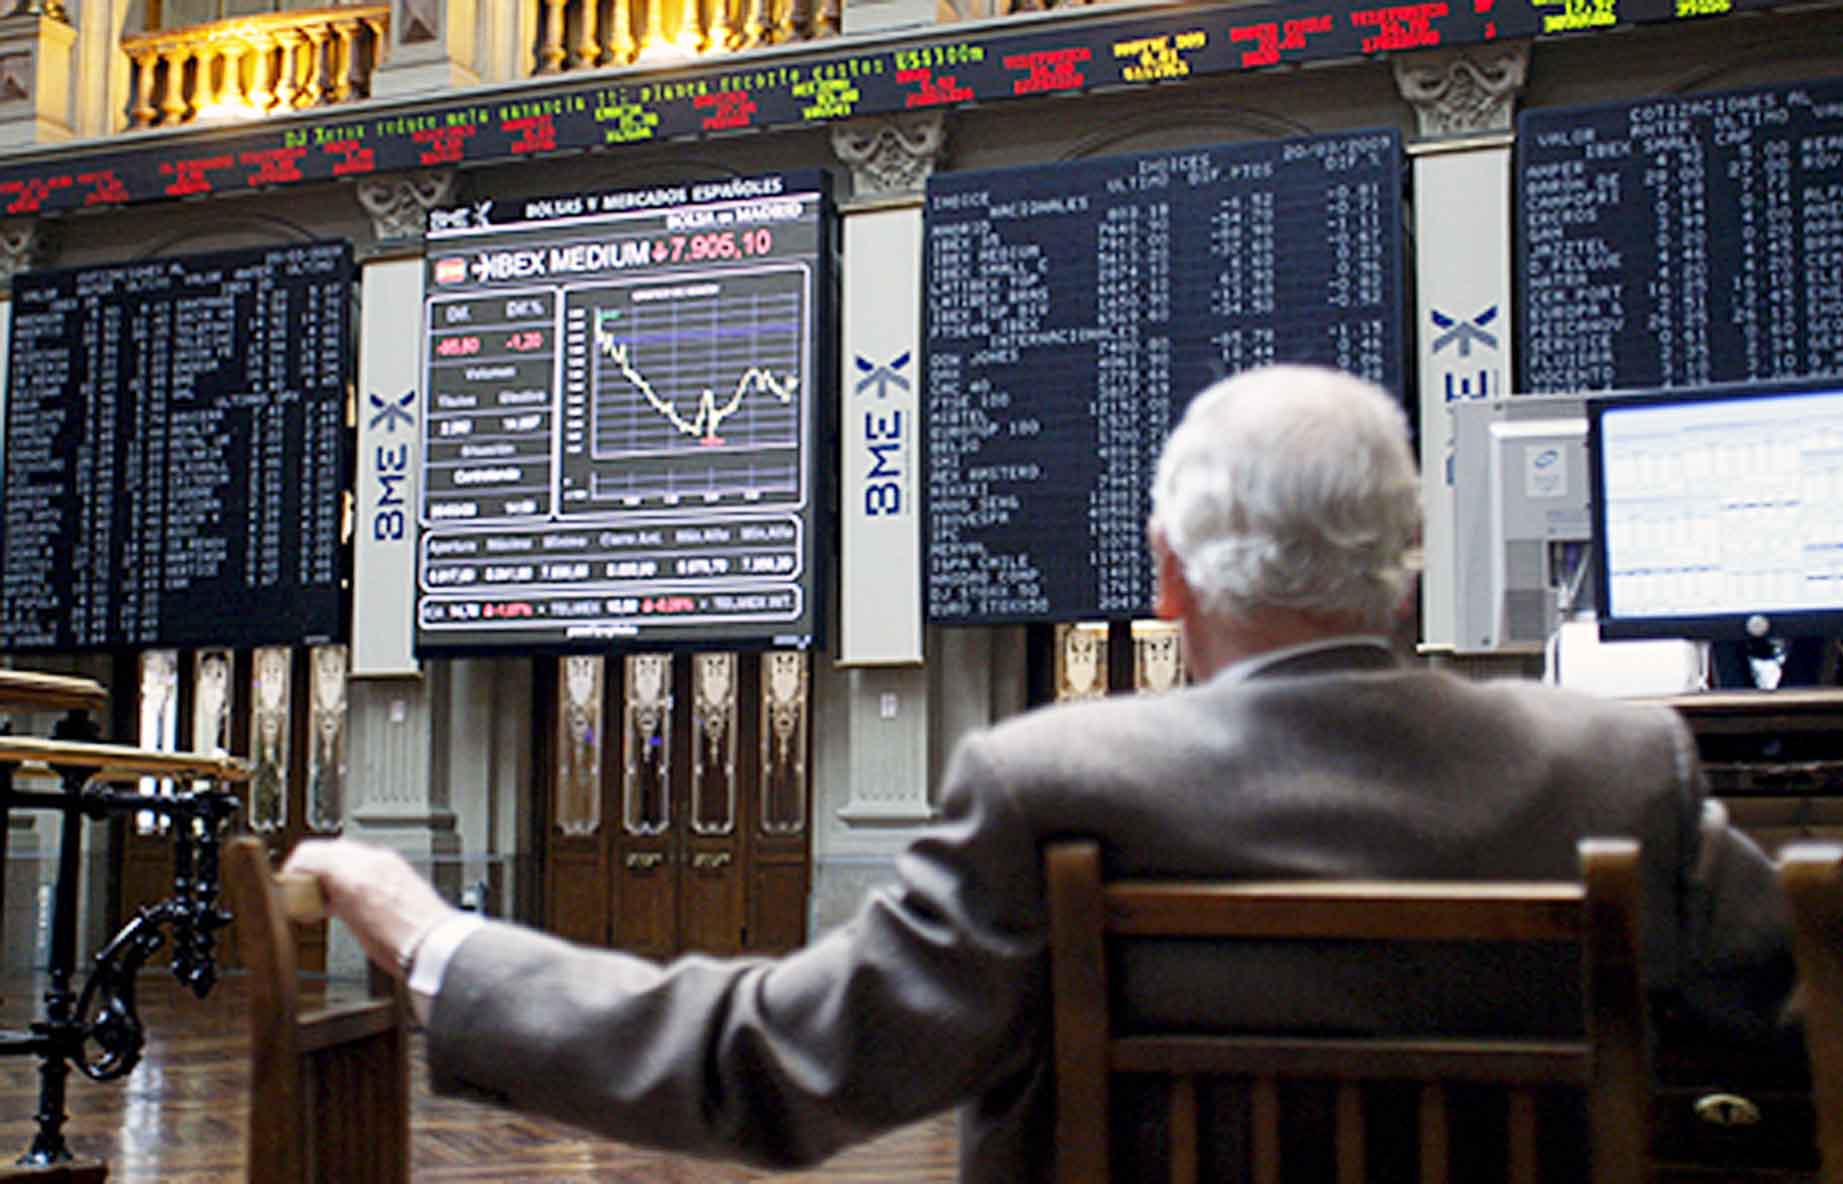
IBEX on the way to 12,000 points

European shares back to the routine increases after two festive days.
The impetus for the report on Employment in the United States, delayed by the Easter has come to Europe in the form of profits, leading the Ibex 35 to register a new maximum of five years.
At the end of the session, the Ibex 35 rises by 0.83% to 11730.50 points.
Meanwhile, other European exchanges earn an average of 1.30%.
The Ibex 35 registered a new yearly high and intraday session Tuesday.
The index rises more than 14% in the year but “still with respect to its European neighbors, climbing around 20% -21% average falls well behind.
With the exception ofTelefónica, which does not awakeuntil the end ofthe capital, have a positive outlook, Tuesdayhave markedhighsAmadeus, Inditex,BME, ViscofanandDia,
Although in the short term it seems that whoever is pulling Ibex are especially Repsol, Banco Santander, Inditex and BBVA.
Read more:
http://www.bolsamadrid.es/esp/aspx/Mercados/Precios.aspx?indice=ESI100000000&punto=indice
https://www.cnmv.es/portal/home.aspx
INSIDE BAR

The ‘Inside Bar,’ is a popular candle formation that only requires two candles to present itself; as this is a direct play on short-term market sentiment looking to enter before the ‘big moves,’ that may take place in the market..
An ‘Inside Bar’ is characterized by the inside candle’s price action being completely covered from price action the day before. The chart below illustrates a textbook ‘Inside Bar.’
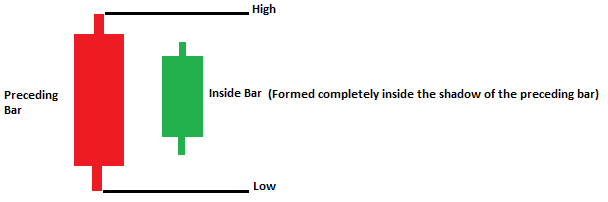

Some traders look to trade inside bars as reversal patterns; hypothesizing that after price has trended up (or down) for an extended period of time – the ‘pause’ in price’s movement (representing the inside bar) precedes a reversal of the trend. In this mannerism, the inside bar is looked at for a short-term trade (or swing) in the counter-trend direction (with the goal of holding the trade for less than 10 bars).
But there is another way to play inside bars; and this is rooted directly from what this candle is NOT telling us.
When we see an inside bar form on our charts, we are seeing a high price and a low price that is inside of the high and low of the day before. This can be looked at as trader’s unwillingness to push price higher or lower for any number of reasons: Perhaps an extremely pertinent report is being issued soon, or perhaps the market had just made a stratospheric leap and traders are tepid about bidding price much higher or lower.
Whatever the reason, the motive is the same: and that motive is looking for potential volatility in an effort to gleam profit. And when we have a situation in which traders are unwilling to bid price higher or lower, we have a potential situation we can look at for future increases in volatility.
So, what is it that this candle is NOT telling us?
It’s not telling us that traders are bidding price higher or lower; that traders are waiting before making the next big move in the asset: And to traders, that means opportunity.

There are good Trading Tactics to deal with “The Inside Bar”.
Traders needs all manner of tactics to help them achieve their goals.
There is a session, were Paul Wallace looks at adding the Inside Bar to your trading armoury.
An effective technique all successful traders are aware of.
Read more:
https://secure.activtrades.com/personalarea/OnlineApplication/Step1?lang=en
https://www.activtrades.co.uk/index.aspx?page=events_webinar

CODERE WITH HIGH GAMES
 Codere deflates the close of trading after rising more than 8% on the day.
Closes with a rise of 1.4% with a high volume of trading.
Presents an important area of resistance at 1.50 euros.
Codere is today the most volatile market securities, proof of this is in the fact that the title accumulates an increase of 390% since the beginning of the year and from the highs of February 24 accumulates a fall of 44 %.
At the close of trading, shares of Codere closed with a rise of 1.42% to 1.43.
However, during the session have gone on to win more than 8%, ranking as the best market value and with a clearly higher than the traded volume in recent weeks.
Finally, it has not been able to confirm above the resistance of 1.50 euros.
Above this resistance the following is in session highs of 27 February at 1.84 euros.
Read more:
http://www.codere.com/en/shareholders-investors/investor-relations/
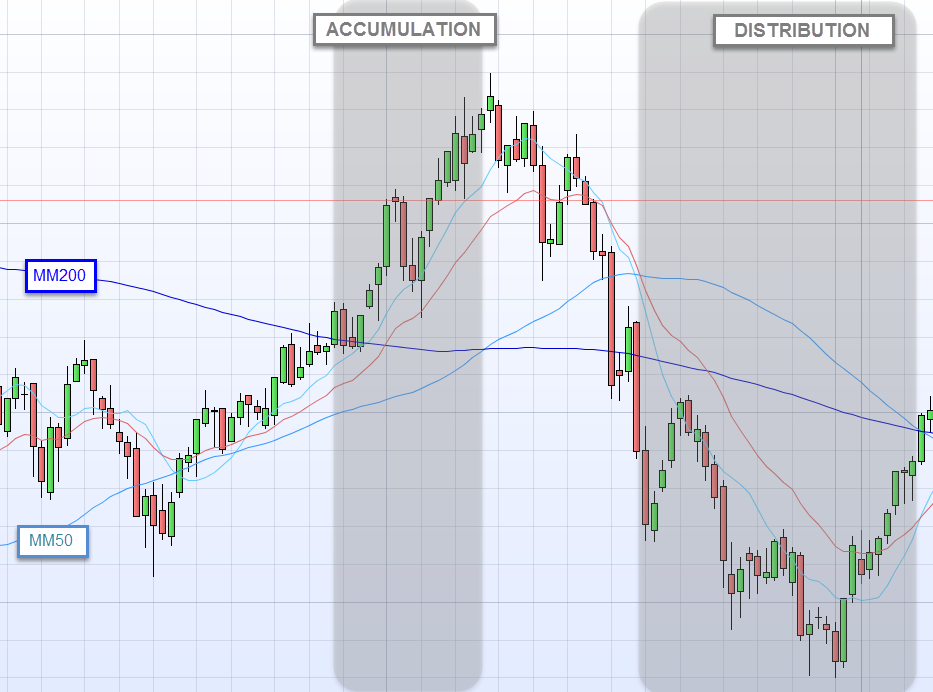
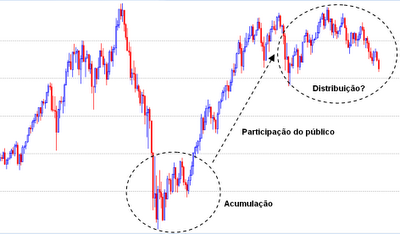
ACCUMULATION and DISTRIBUTION
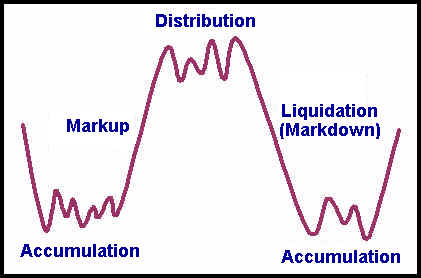
With the DOW THEORY of Charles Dow, the MAIN TRENDS.
PROFESSIONAL INVESTORS adjust their action to each of these 3 PHASES:
ACCUMULATION PHASE.
The best time to buy an asset, usually enjoyed by investors better prepared.
It is the time when the market has assimilated all the negative information that held the downtrend, and is showing signs of reversal to an uptrend.
At this stage we find the PRICE above the Simple Moving Average of 200 periods (MM200) and this above the Simple Moving Average 50 periods (MM50).
PHASE PUBLIC PARTICIPATION.
The stage at which most investors trend followers begin to purchase the asset.
The price engages the trend and occur rapid and significant price rises, with the market to assimilate the new good news.
DISTRIBUTION PHASE.
It appears when newspapers began writing about the substantial increase in the asset gains, the volume of operations and begins to increase public participation becomes even greater. This is where savvy investors entered the active and begin to undo their positions, pocketing the profit.
At this stage we find the Simple Moving Average 50 periods (MM50) above the Simple Moving Average of 200 periods and this up PRICE. (concepts that develop in another post later).
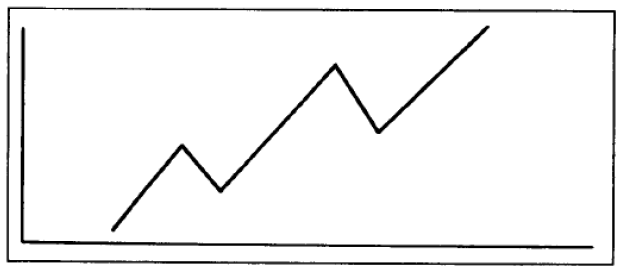
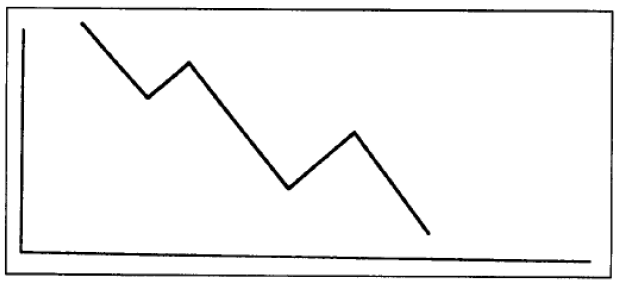
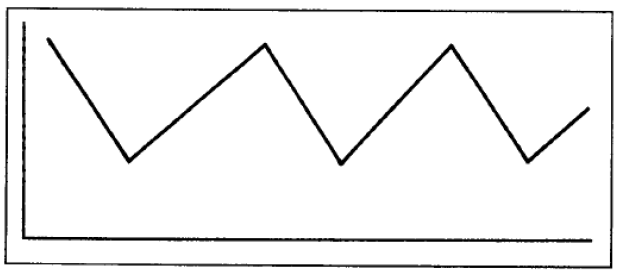
MARKET TREND

The trend corresponds to the direction of the market, that is, the direction in which they move the high and low price points.
We can identify three types of trends: HIGH TREND – LOW TREND – TREND SIDE
TREND HIGH – Maximum and minimum progressively higher or successive breaks of resistance.
There is a buyer’s market with consequently higher prices.
TREND LOW – Maxima and progressively lower minimum or successive breaks brackets.
There is a seller’s market accordingly with falling prices.
TREND SIDE – Maximum and minimum at similar levels.
There is a market aimlessly with constant prices.
DRAWING TREND LINES
The design of a TREND LINE HIGH makes joining at least two minimum.
The 2nd. minimum (3) should be higher than 1st (1).
Identified the two minimum, we draw a line segment that one, extending the line to the right.
The trend is confirmed only if there is a 3rd minimum (5) even higher.
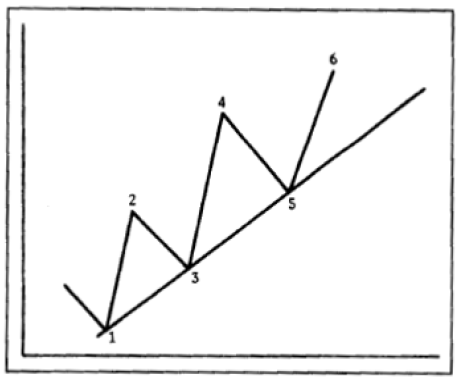
The design of a TREND LINE LOW makes joining at least two peaks.
The 2nd maximum (3) should be lower than the 1st (1).
Identified the two maximum, we draw a line segment that one, extending the line to the right.
The trend is confirmed only if there is a 3rd maximum (5) even lower.

UTILITY OF A TREND LINE
1) Identify any points BUY (HIGH TREND) or SELL (DOWNTREND) points.
2) The rupture of a trend line is probably the first and best trend change signal.
In these circumstances we can take a relatively safe position since the level of risk (STOP LOSS) is close and well identified.
DOW THEORY
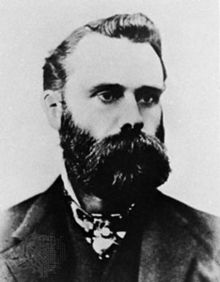
THE DOW THEORY is a theory that addresses the movement of prices and provides a technical basis for its analysis.
Charles Henry Dow formulated in 1884 the theory that has formed the basis of ANALYSIS GRAPHIC best known for TECHNICAL ANALYSIS.
Charles Dow, American journalist, was the co-founder of DOW JONES Co. along with Edward Jones and Charles Bergstresser.
DOW founded the THE WALL STREET JOURNAL and as a result of his research on the movement of markets, created the first stock index, the DOW JONES INDUSTRIAL AVERAGE (DJIA).

1) MARKETS ALL CASH.
All possible factors that affect the price of the asset, are discounted by the market players. They consider and incorporate instantly in price, all the news, accounting and financial results, extraordinary events, etc.
2) THE MARKET MOVES FOR 3 TRENDS.
Trends can be high or low, and may also be lateralization.
The trends are broken down according to their duration in:
PRIMARY TREND = TIDE (busiest sea); can last for months or years.
SECONDARY TREND = WAVES (formed with the rise or fall of the tide); can last from three weeks to three months. Functions as correction movements and can resume between 1/3 and 2/3 of the move.
TREND TERTIARY = RIPPLES (slight wave surface formed between the waves); lasting less than three weeks.
3) PRIMARY TRENDS HAVE 3 PHASES.
For Dow, the main trends (primary) are composed by:
Accumulation Phase. The best time to buy an asset, usually enjoyed by investors better prepared. It is the time when the market has assimilated all the negative information that held the downtrend, and is showing signs of reversal to an uptrend.
Phase Public Participation. The stage at which most investors trend followers begin to purchase the asset. The price engages the trend and occur rapid and significant price rises, with the market to assimilate the new good news.
Distribution phase. It appears when newspapers began writing about the substantial increase in the asset gains, the volume of operations and begins to increase public participation becomes even greater. This is where the savvy investors who entered active in the accumulation phase to begin to undo their positions, pocketing the profit.
4) VOLUME CONVERGENT
Dow recognizes the volume as a secondary factor, but important for new price trends are confirmed. To change the market trend, there should be a significant increase in volume in the negotiations. Dow believed that while there were no high volume to confirm the trend change, maintaining the previous trend.
5) PRINCIPLE OF CONFIRMATION.
The indices and means must confirm each other.
To check a trend is necessary that the behavior of the indices coincide with the trend. Uses the closing prices for the calculation of averages, not considering the maximum and minimum for the calculation of indices.
6) THE TRENDOCCURSWHILETHERE IS NOSIGNSOFREVERSAL.
The trend is effective until replaced by another opposite. Until the contents are confirmed, it is considered that the former tendency remains in place despite the apparent signs of change. This principle seeks to prevent premature exchange position (long or short).

CRITICISM TO THE DOW THEORY
Although the Dow theory have done a good job predicting various situations markets for high and low, it did not escape for some criticism over the more than 100 years. In general Dow Theory loses 20% to 25% of a motion before generating a trend signal, which many traders considered to be too late join.
A buy signal is given when the price breaks the value of the previous peak, indicating that a new peak above this will be formed. This point is precisely the value in many technical systems to follow trends point to purchase and begin to participate in the movement.
Supporters of his theories, say DOW never aimed to predict market trends. I just wanted to capture a significant part of the really important movements of the market, identifying trends with the necessary confirmations.
Which independently be the reason, clearly understand the fundamentals of Dow Theory is critical to be able to use technical analysis tools properly.

Recent Comments